
UM Housing Capstone
Problems to Solve
The University of Montana’s Housing had two issues. First, they wanted to update their report that tracks the number of applications from an Excel file to an interactive dashboard.
Secondly, they wanted to see if they could predict the number of students who will not show up for student housing at the start of the school year, as this leads to wasted beds and resources.
Dashboard
Data Source and Pipeline
The data for this dashboard comes from a database and housing management software called StarRez. The site pulls a report of current applications weekly. One thing to be aware of is that this database overwrites old student information, so a static copy of older years is needed for year-to-year comparison.
Due to not wanting to purchase API access for this report, the data it feeds on is stored within a SharePoint online site. Each week, when new application data is pulled, it is pasted over the old information for the current year. This then means there is no need to redo connections within Power BI, simplifying the process. The Power BI dashboard is also stored in the same SharePoint site, simplifying access.

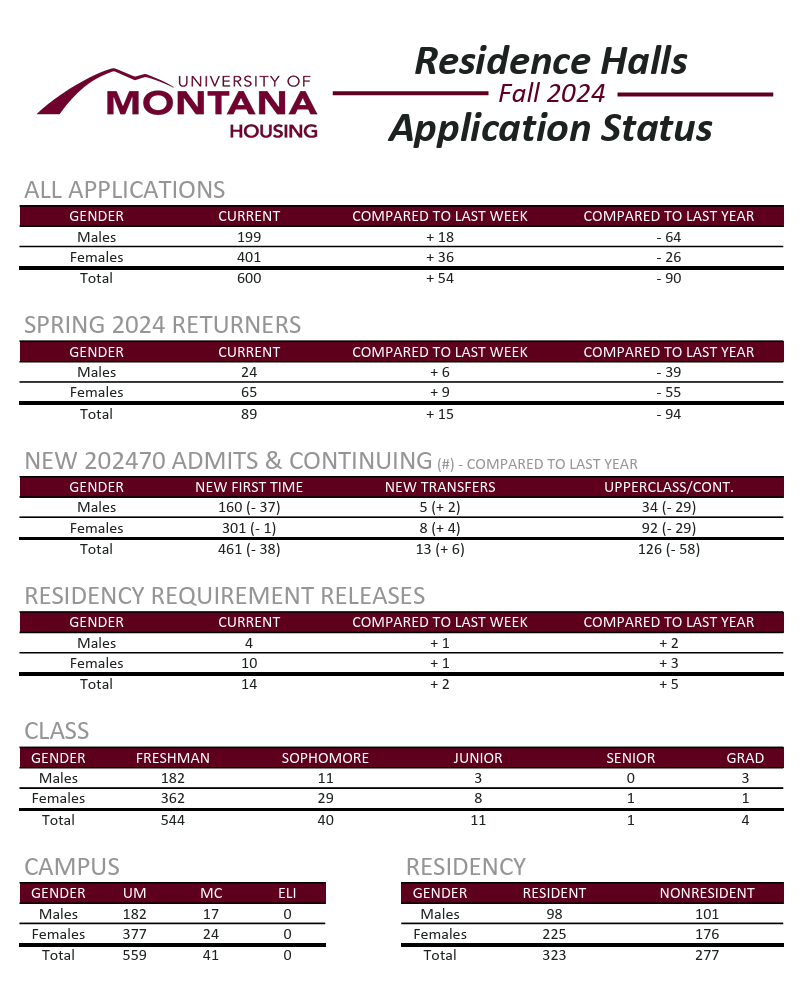
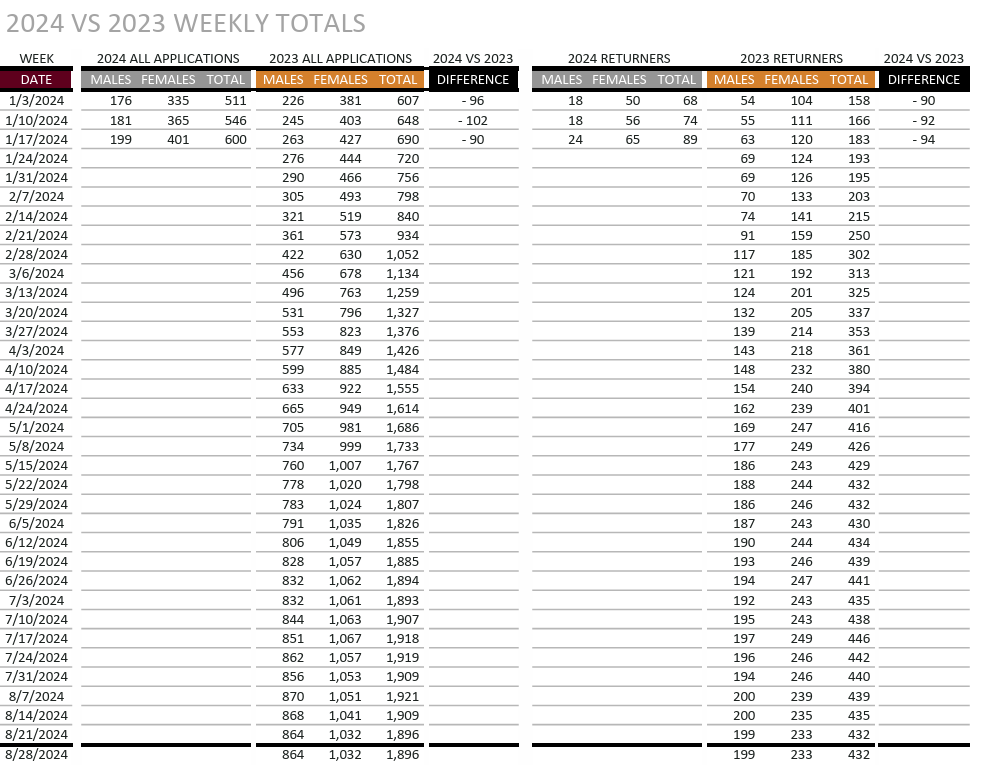
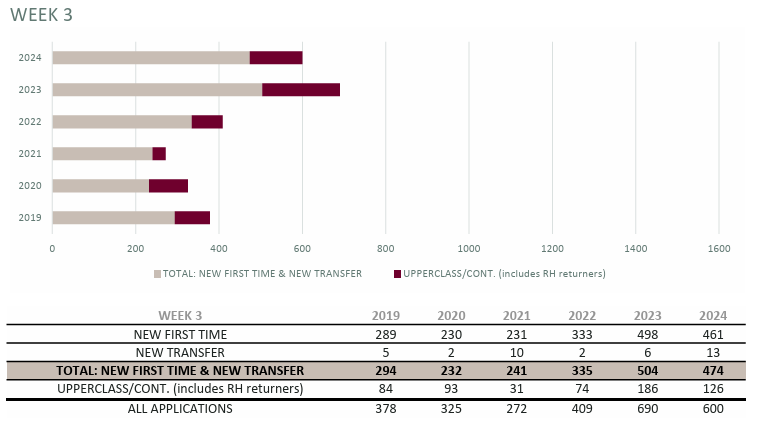
Original Report

Updated Dashboard
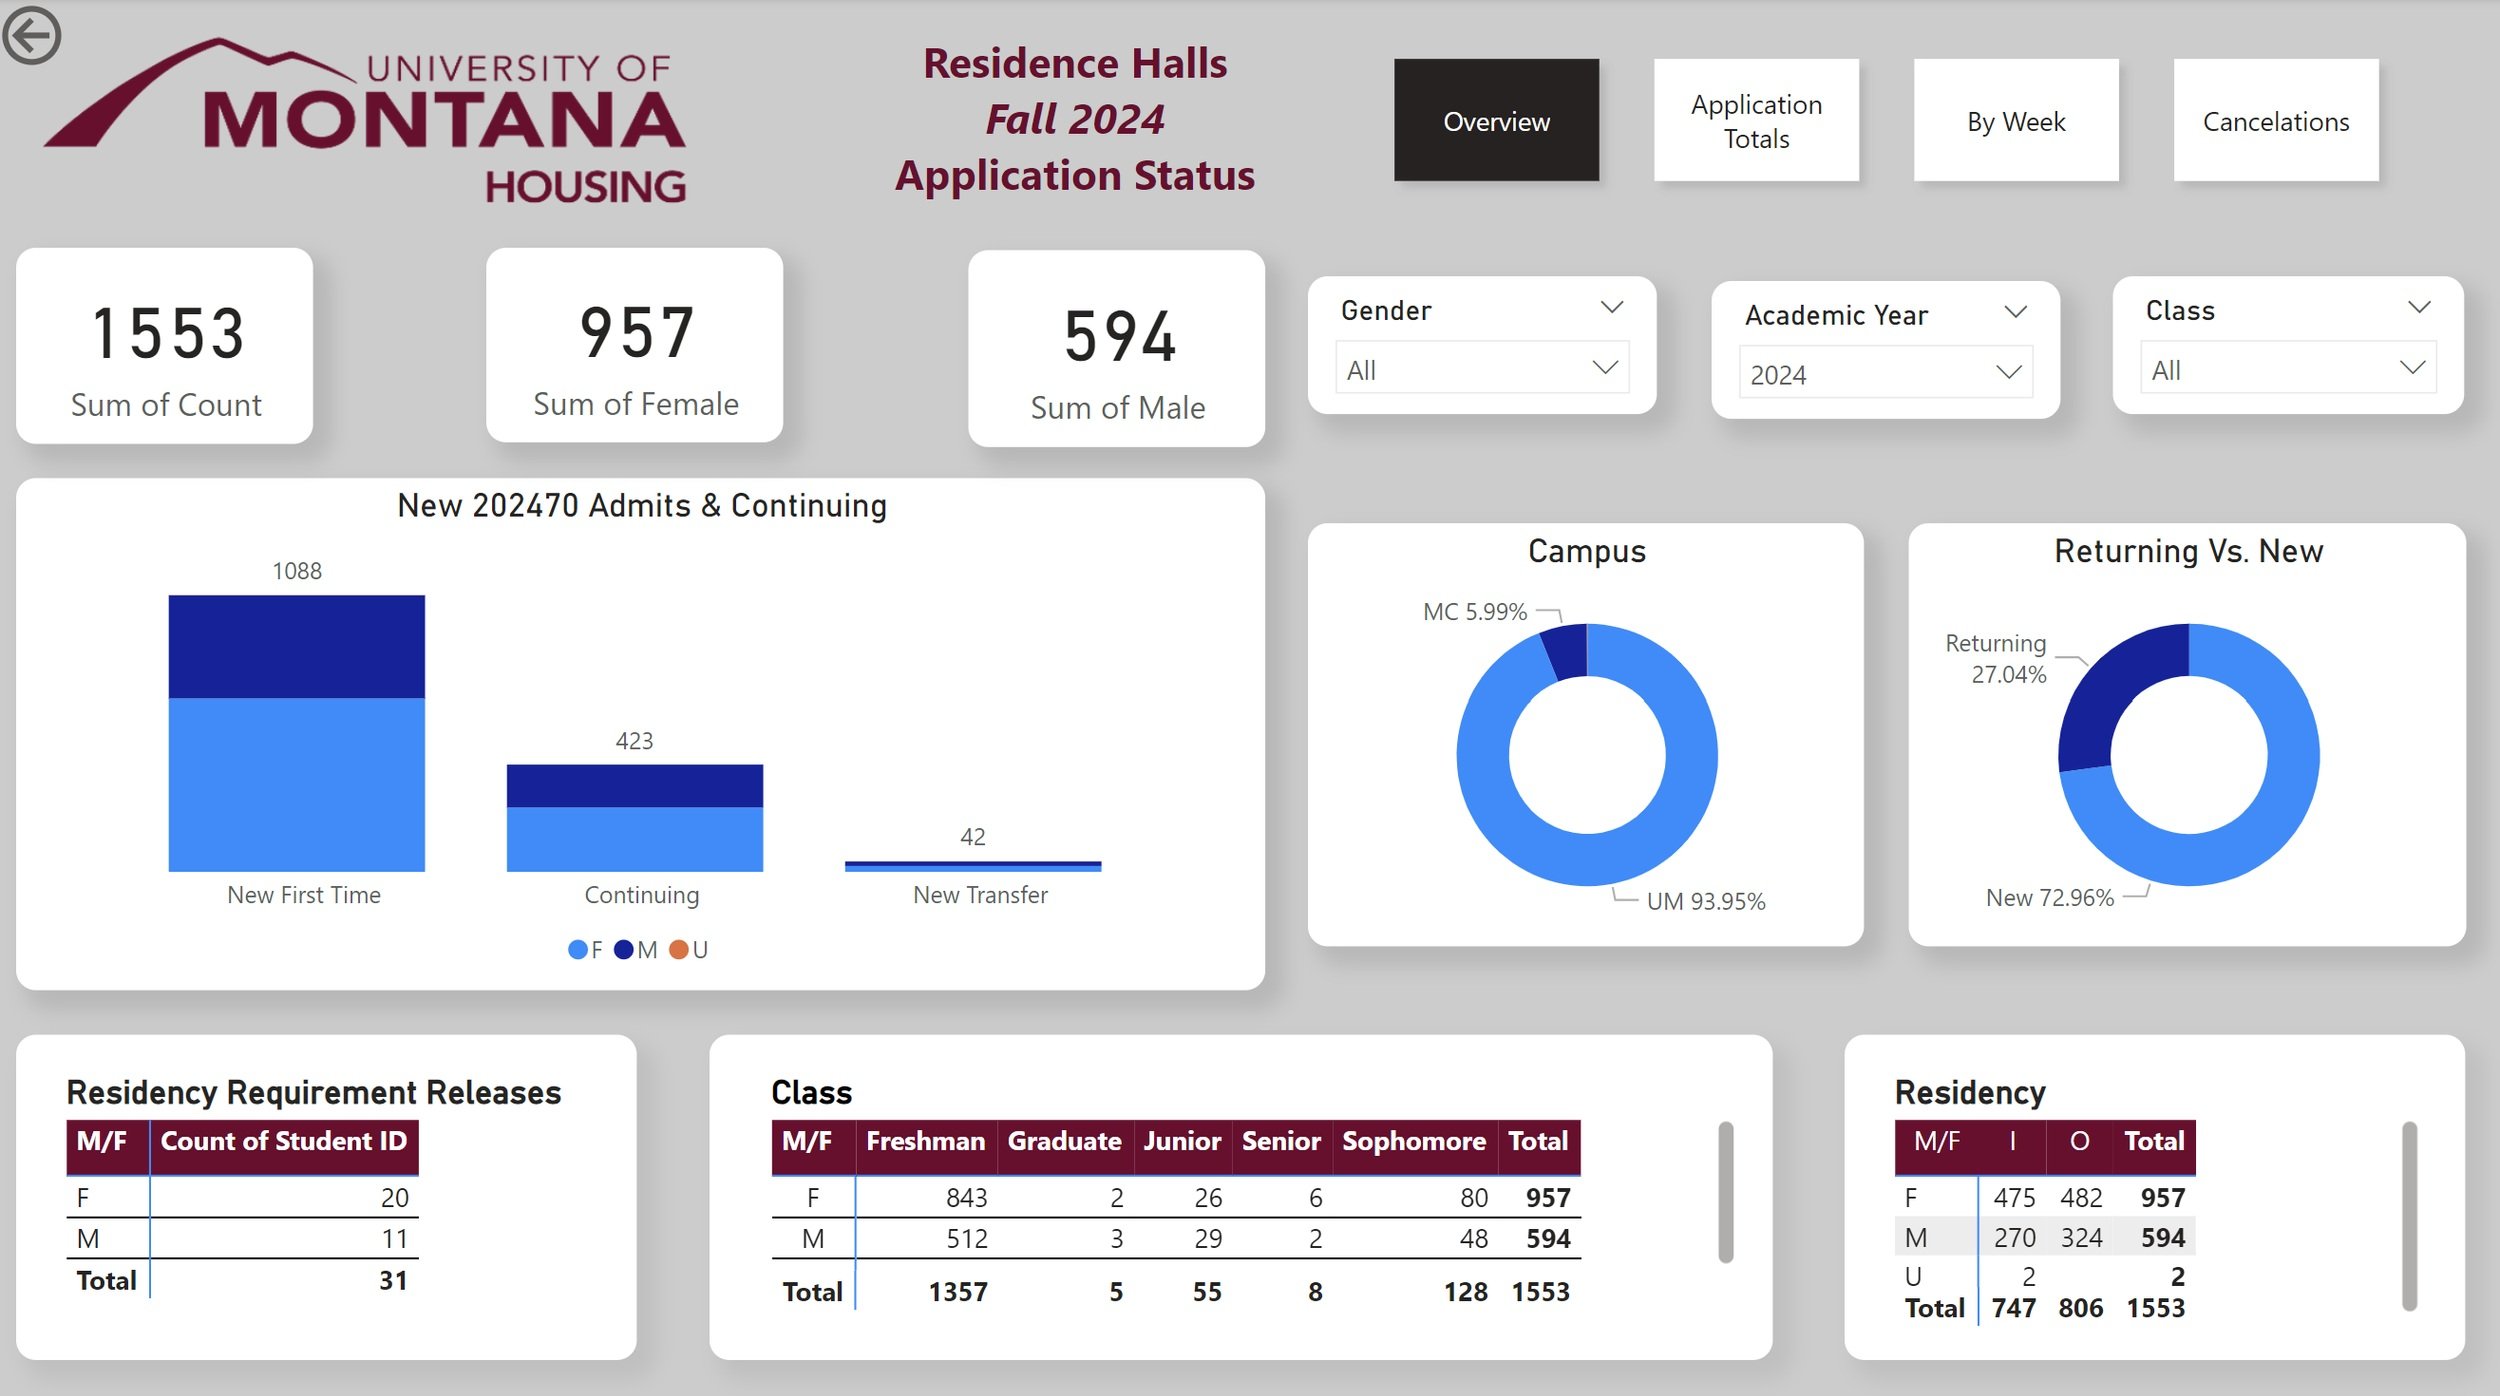
Main Page, provide an overview on the number of applications, including breakdown by different factors
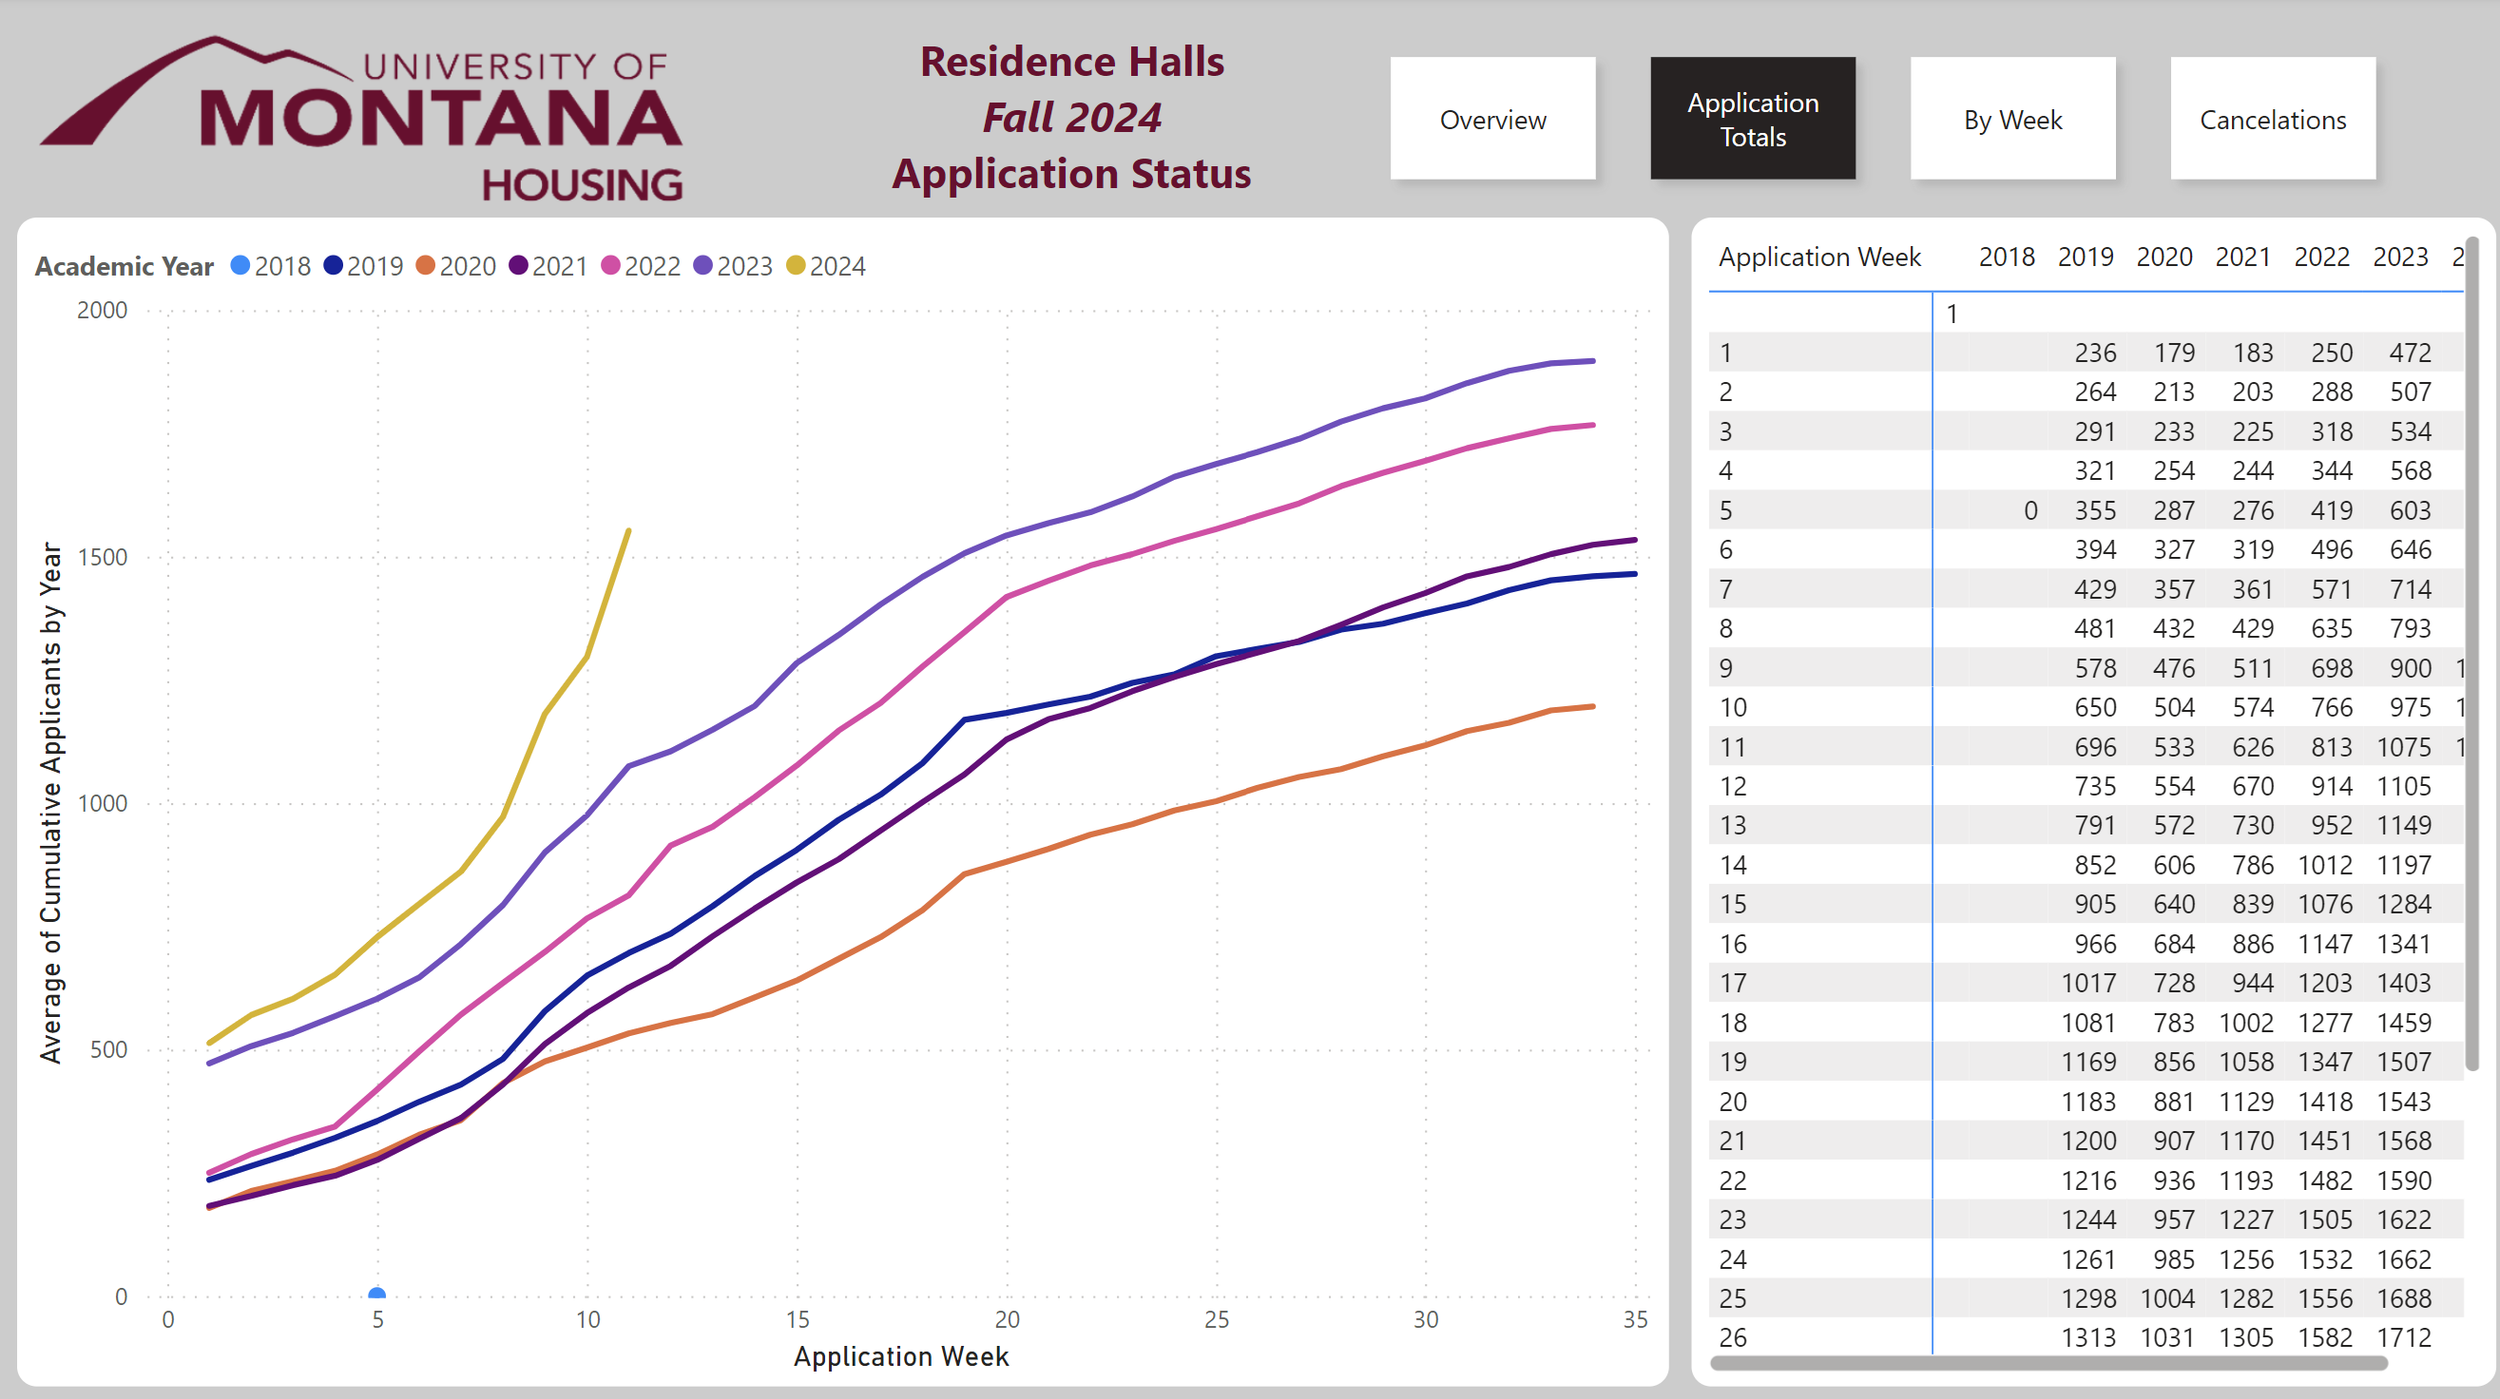
This page gives a year by year comparison going back to 2019 both as a graph and as a table. One thing to not is the by week numbers slightly decrease as the year goes as people cancel their applications.
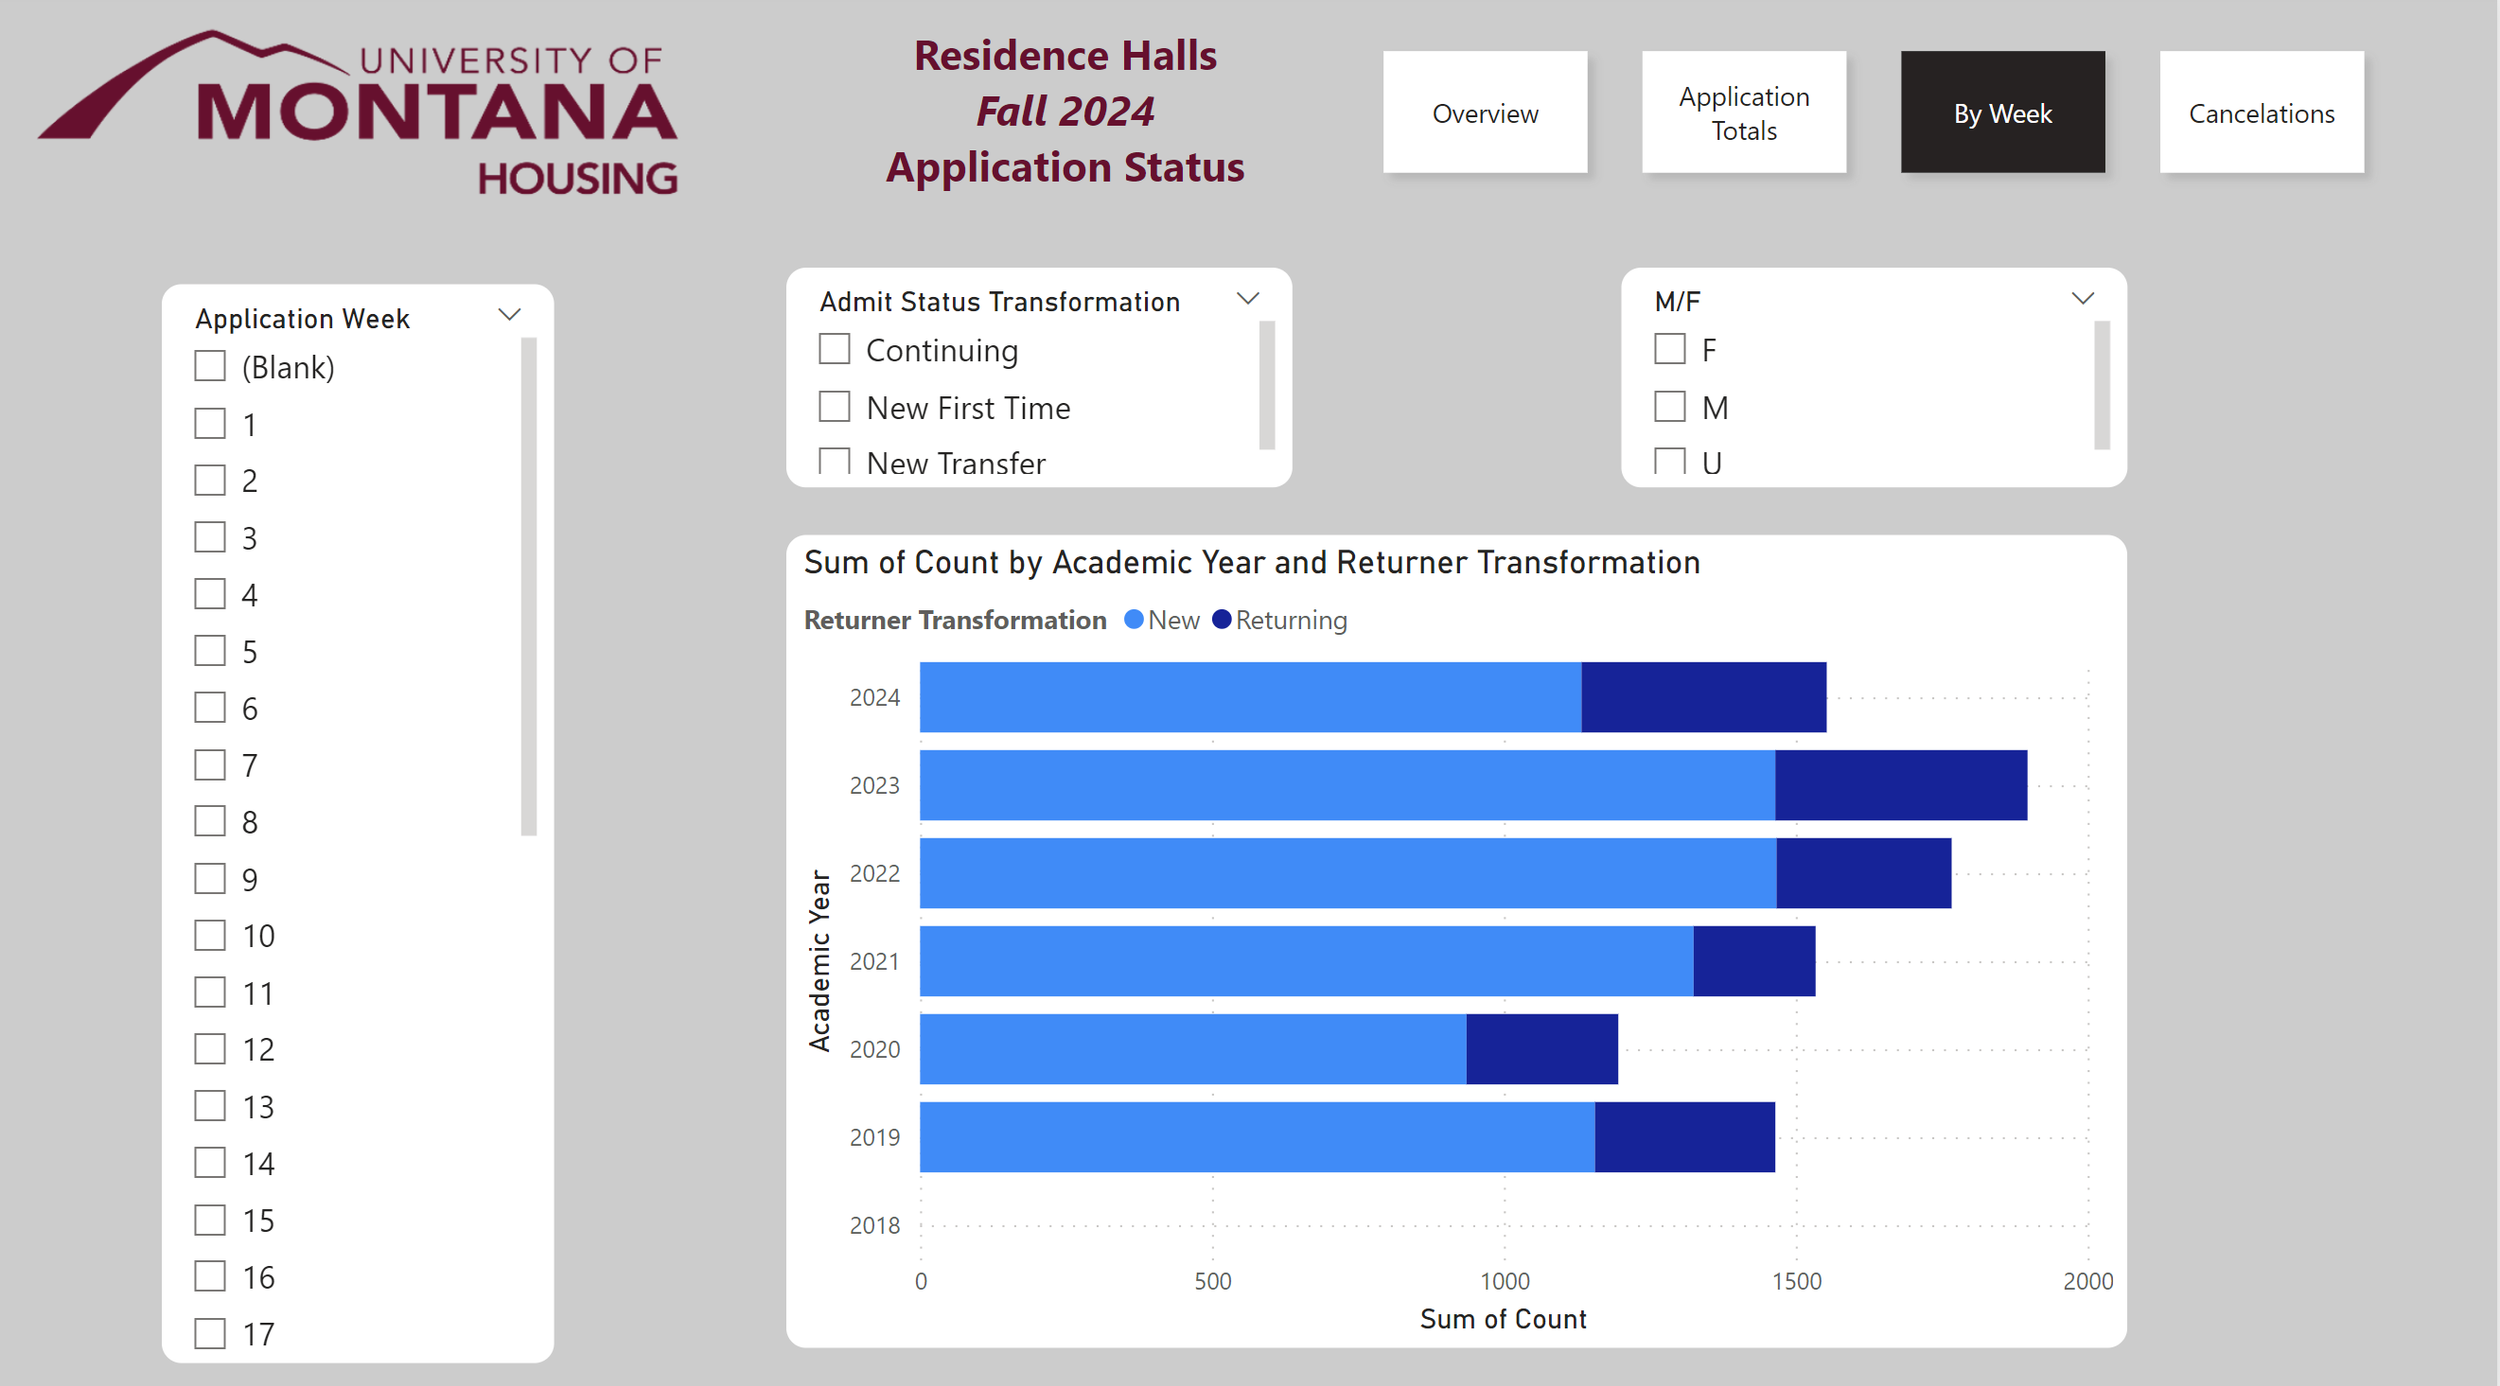
This slide allows for a breakdown by week. Allowing users to compare the number applicants in any given week
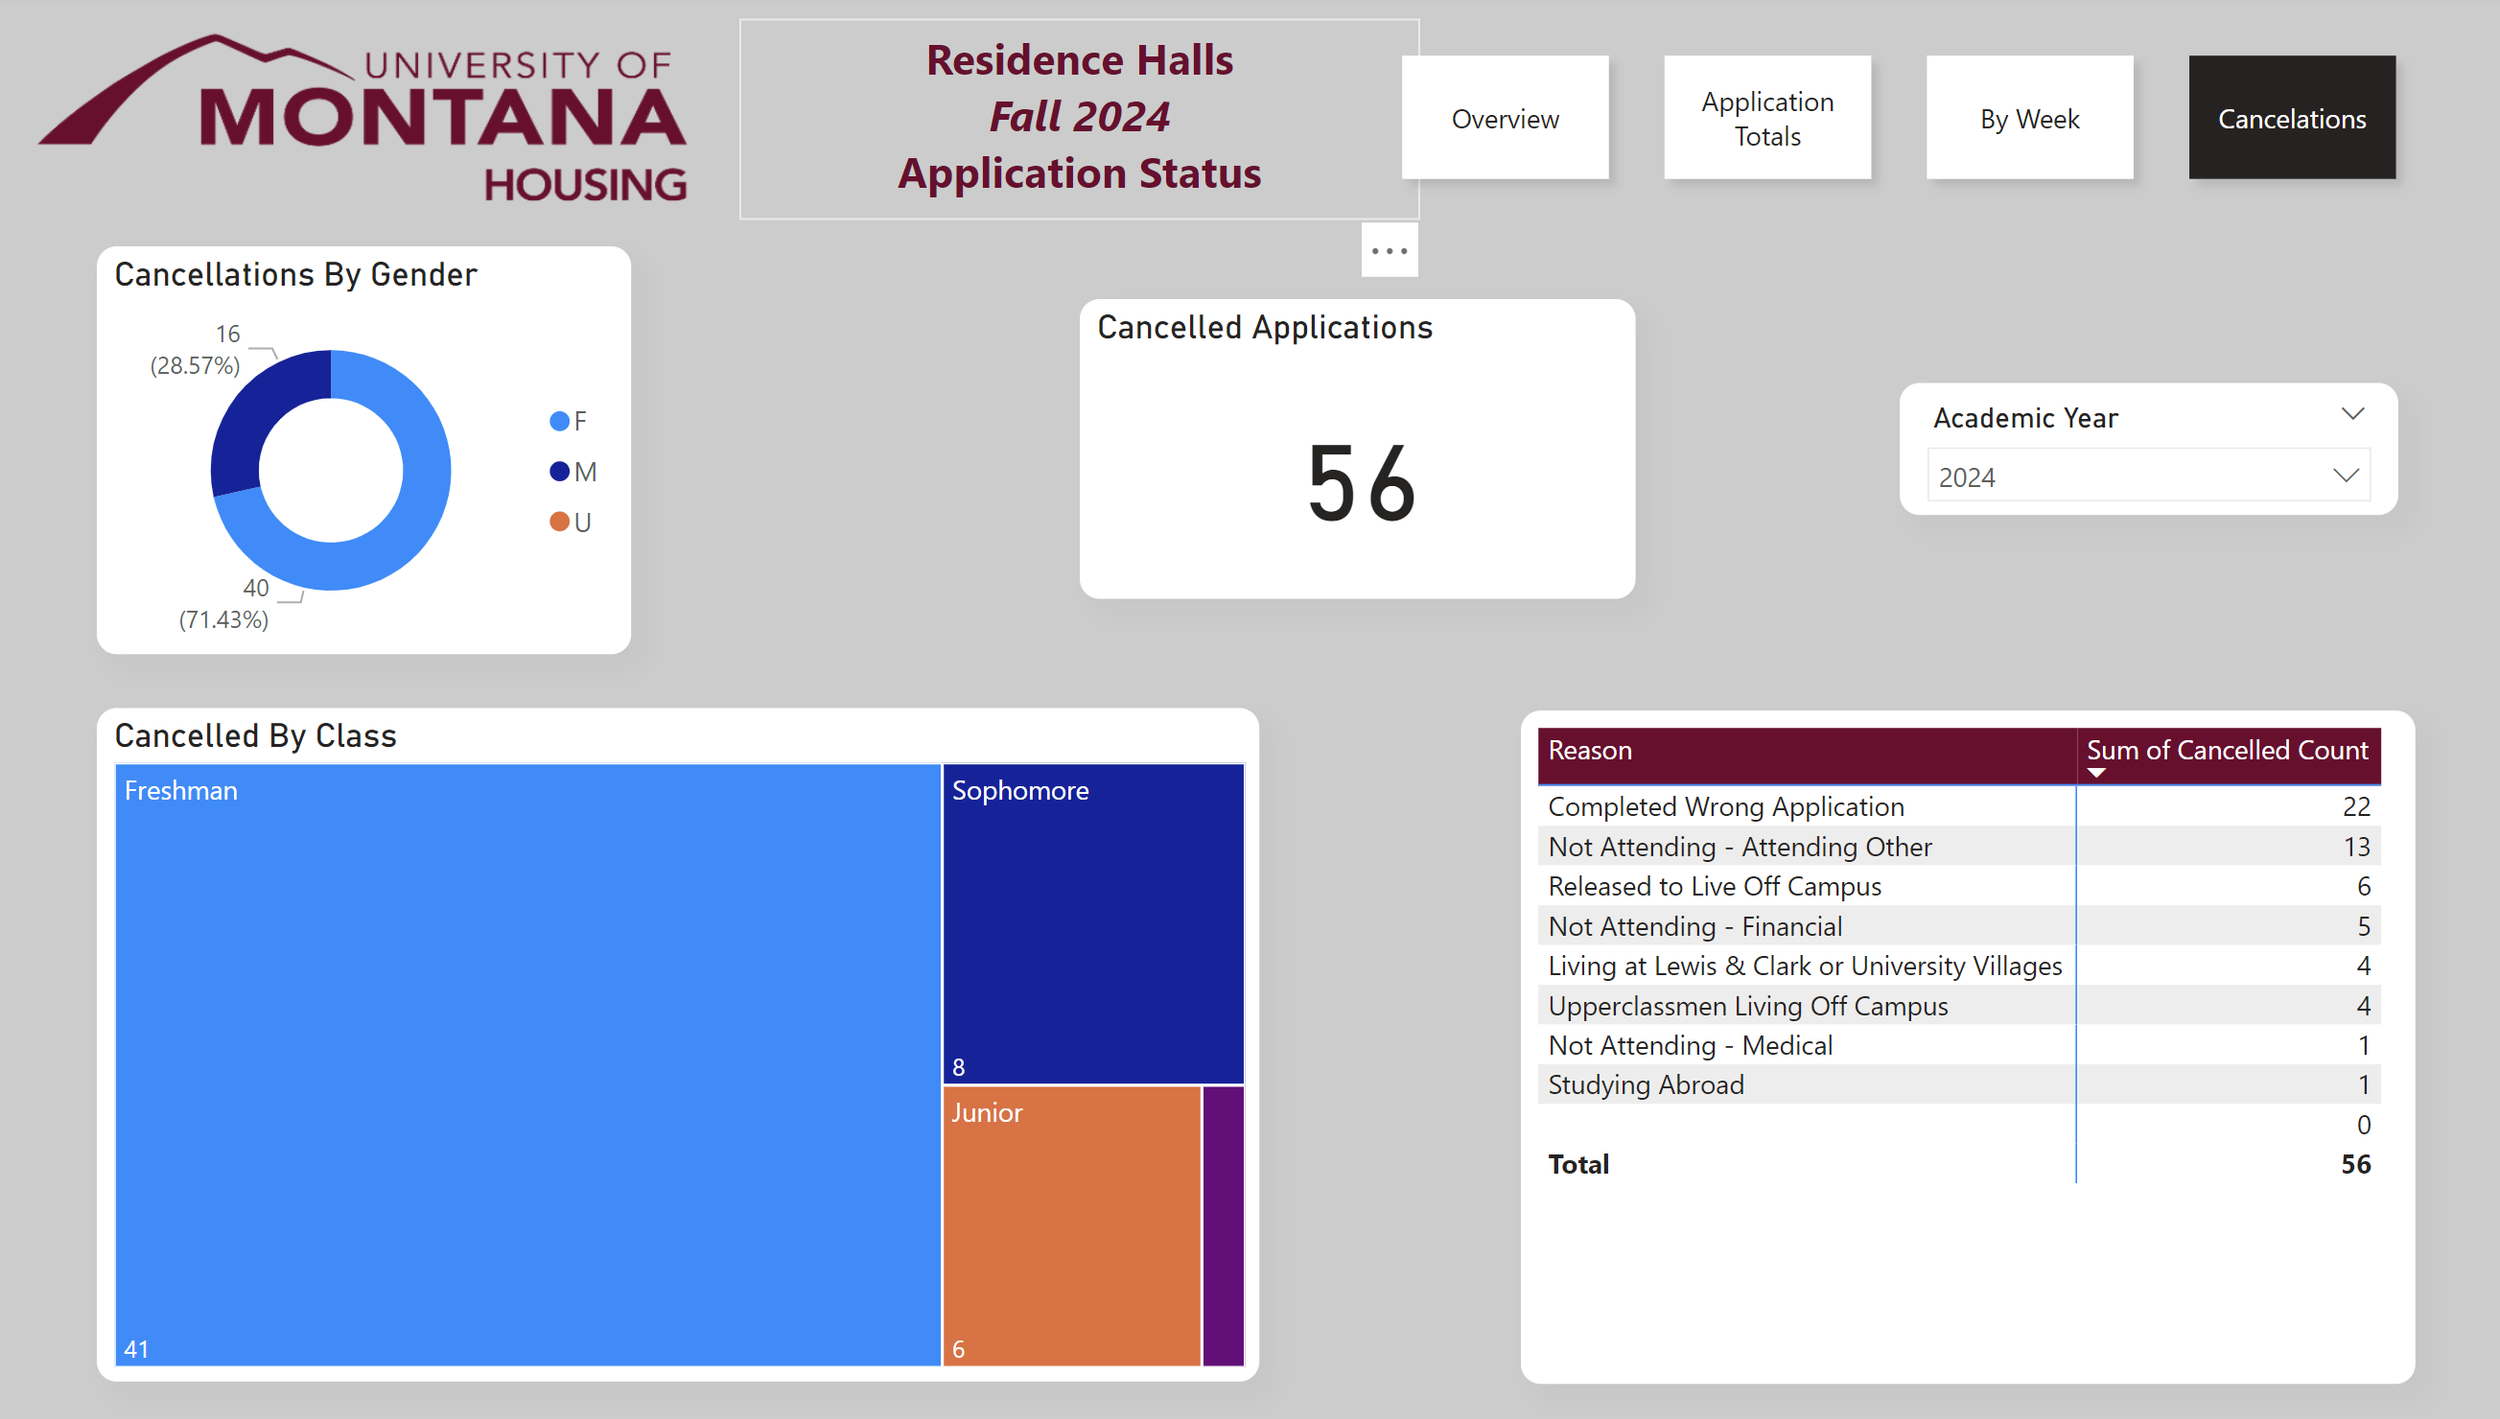
This slide shows a breakdown of applicants that canceled their applications. Application reason needs to be a table because there are over 20 different cancelation reasons which would not fit well on a graph.
Analysis
Overview
University of Montana Housing wanted to see if there was any ability to predict the number of students who applied for housing but did not show up at the beginning of the school year. There is a lot of explanatory information that could not be collected for this analysis, such as financial aid status and GPA. Different statistical models were still tried with the available data.
Data
The dataset available for this analysis is the same one used to make the dashboard; thus, there is a limited number of variables. The dataset contains 9,797 rows of which 351 are no-shows. For this analysis, we will be using no-shows as the dependent variable, which are students who canceled their applications in August, the month the school year starts. To the right is a list of variables used and their meaning.
Summary Statistics
Looking at some summary statistics, the majority of students in raw numbers are freshmen, but as a proportion, all other class levels are more likely not to show up.
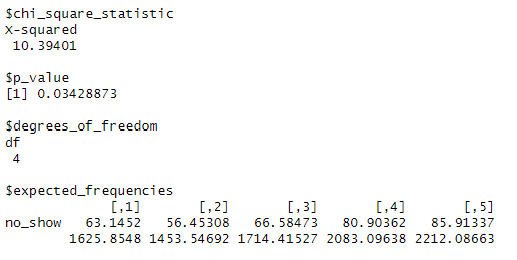
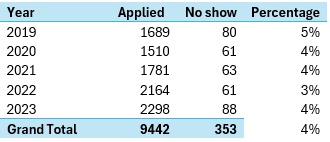
Looking at the numbers by year, we see that between 3% and 5% of students did not show up in August. Checking this with a Chi-Squared test, which checks to see if observed frequencies differ from expected. The test shows that the difference between 2019 and 2022 is significant. As more years are collected it would be interesting to see if this trend continues.

Logistic Regression
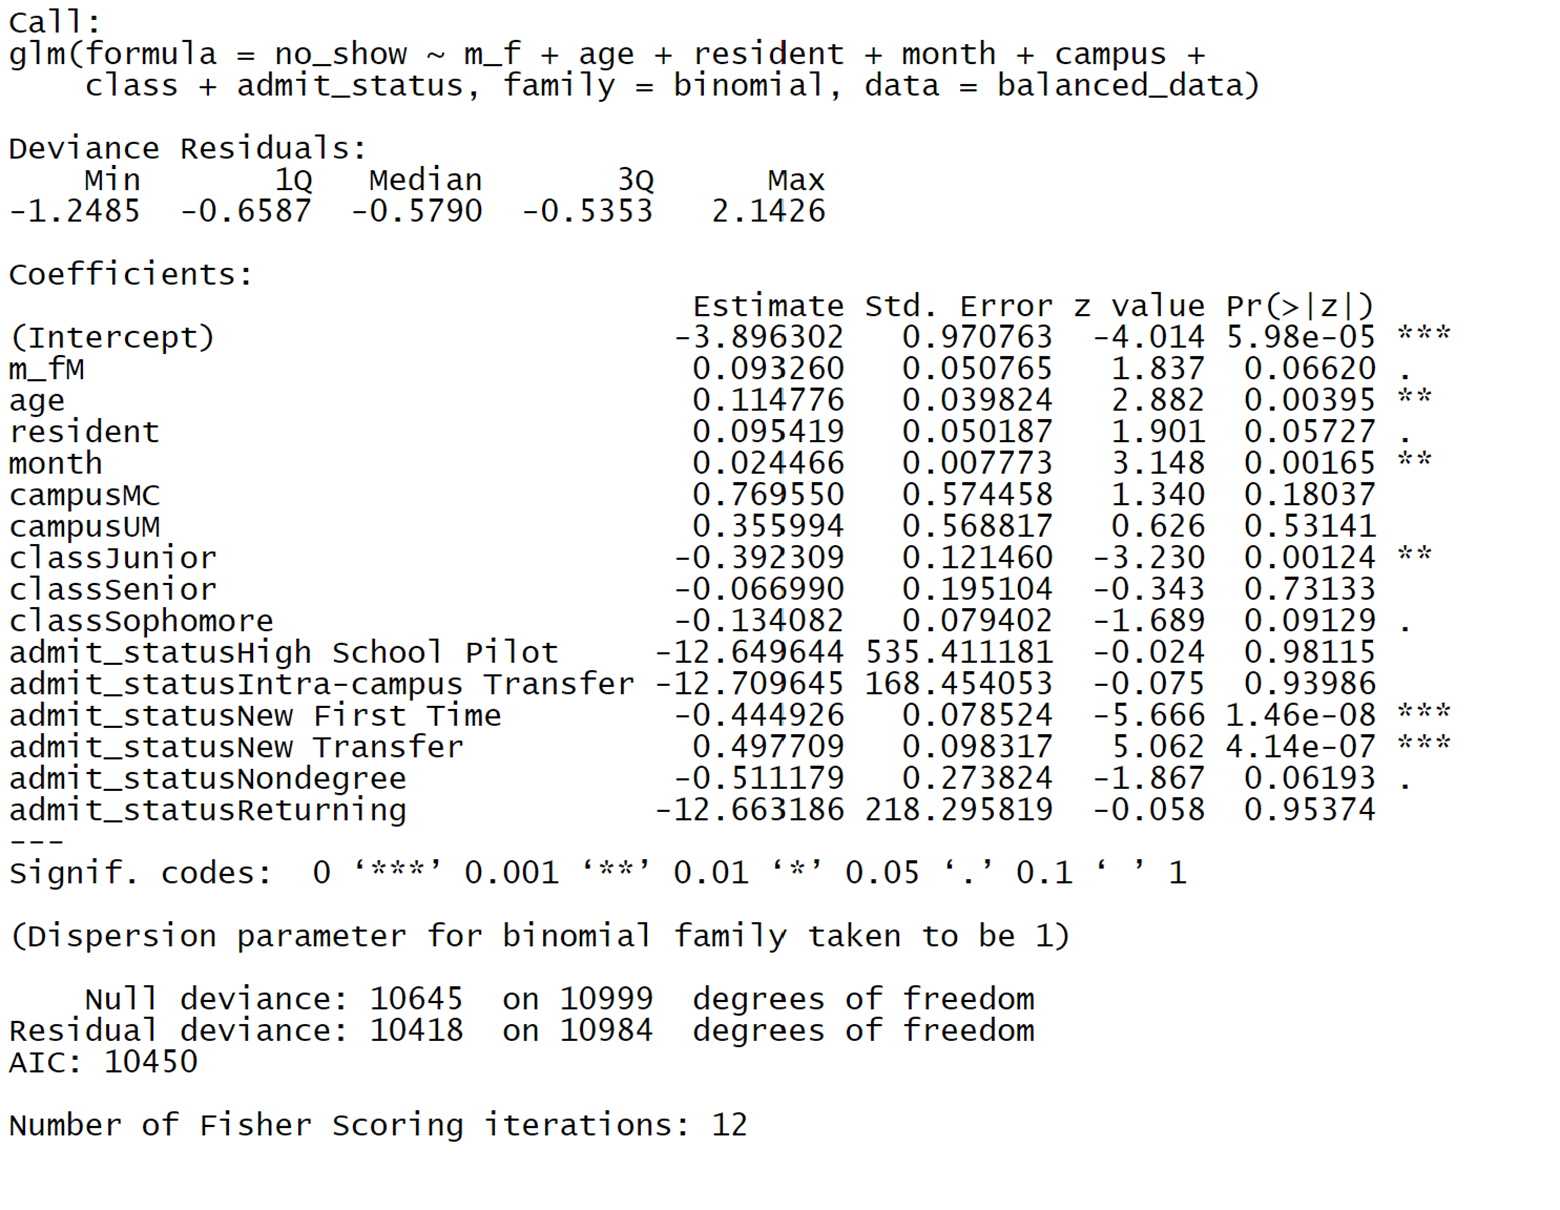
The first model tried was a logistic regression to see if we could build a prediction model. This is because no-show is a yes or no answer. The data was split into a 70/30 training testing split to retain the ability to test how effective the model built off the training data was. We will use no-show as the dependent variable, while the independent variables will be gender, age, residency, month of application, campus, class, and admit status.
From the regression results to the right, we see that overall, this model does appear to show some significance with age, month, and admit status, all having low p-values. When we test the predictability of the model on the test data, we get a Kappa score of -0.0002, which means that the model is as predictive as just random chance. With a logistic regression not bearing any fruit, we will move on to the next model.
Decision Tree
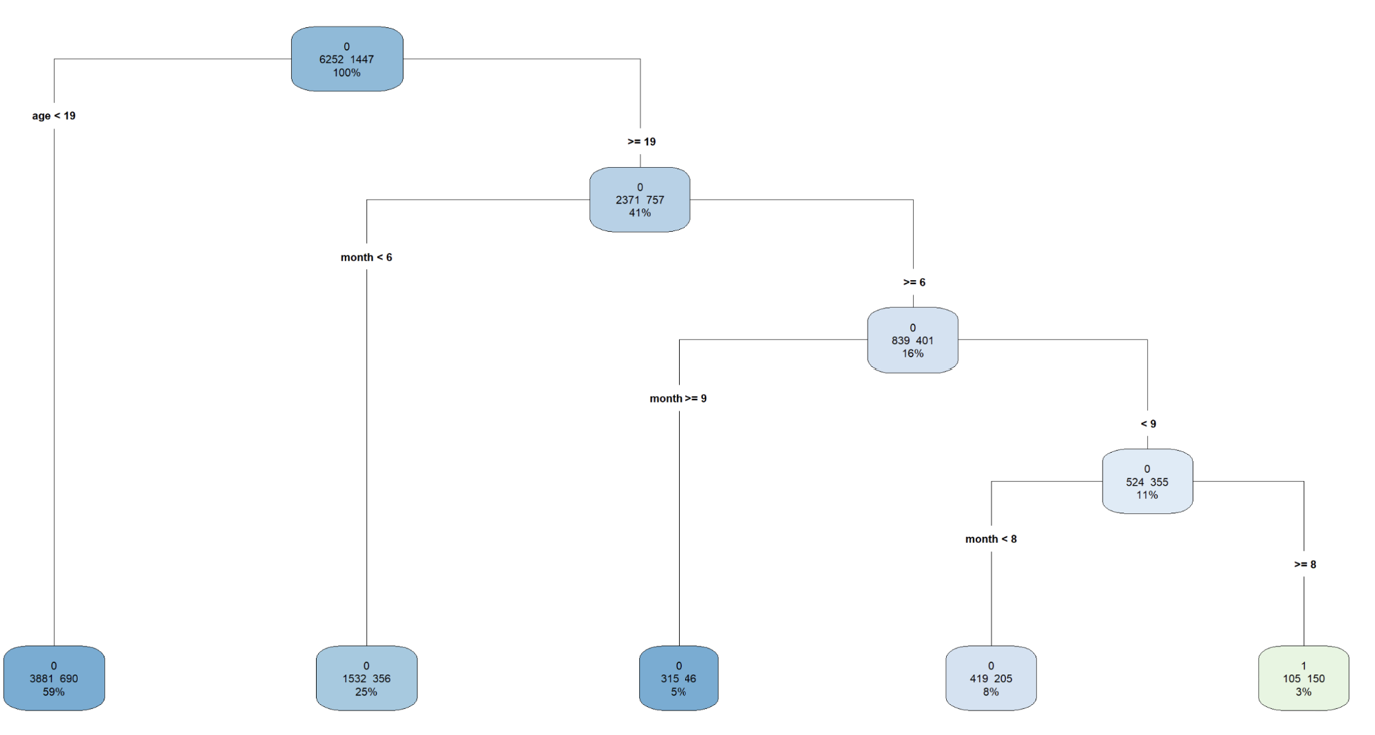
With logistic regression's predictive abilities lacking, a decision tree was used to see if it could predict the likelihood of a student no-show. Decision trees make predictions by splitting data on key features such as age or class level.
From the output to the right, we see that the model purely splits based on an applicant's age and the month they applied. When testing the model on the test data set, we get an accuracy of 81%. When predicting the number of no-shows, you’d want a more accurate model due to the ramifications of being incorrect, either not having enough beds or too many.
Conclusion
The University of Montana Housing had two problems. First, they needed a new version of their application report that tracks the number of student applications to live in university-owned housing. This was accomplished by rebuilding the report in Power BI. They also wanted to see if a predictive model could be built to estimate the number of students who will not show up at the start of the school year. Unfortunately, with the available data, this was not possible using a logistic regression or decision tree. With further tracking, it is possible they could build a rough estimate based on the percentage of total applications, with numbers ranging between 3-5% of applicants not showing in a given year. For statistical modeling, more predictive data may be needed, such as financial aid status and GPA.